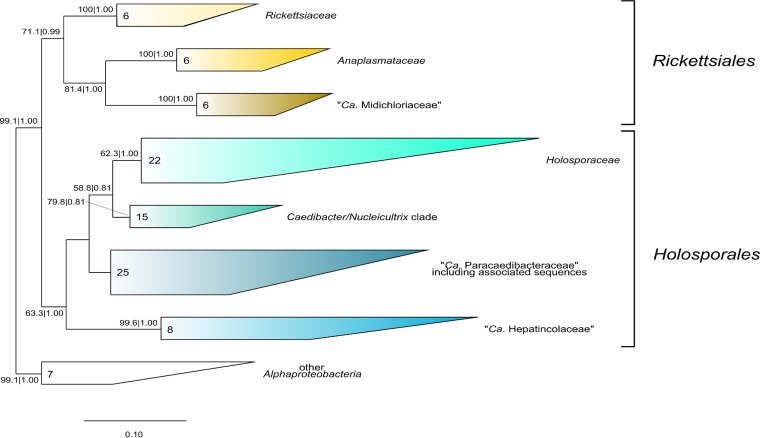
FIG 3.
Phylogenetic tree topology of the maximum likelihood analysis employing the GTR+I+G model, showing a different relationship between the families of the order Holosporales with respect to the Bayesian inference tree (Fig. 2). Species selection and nucleotide columns used to calculate the tree are the same as those for the tree in Fig. 2. Numbers indicate maximum likelihood bootstrap values after 1,000 pseudoreplicates and Bayesian posterior probabilities after 1,500,000 iterations (values below 50% and 0.5 are not shown). Scale bar, 10 nucleotide substitutions per 100 positions. Ca., Candidatus.

