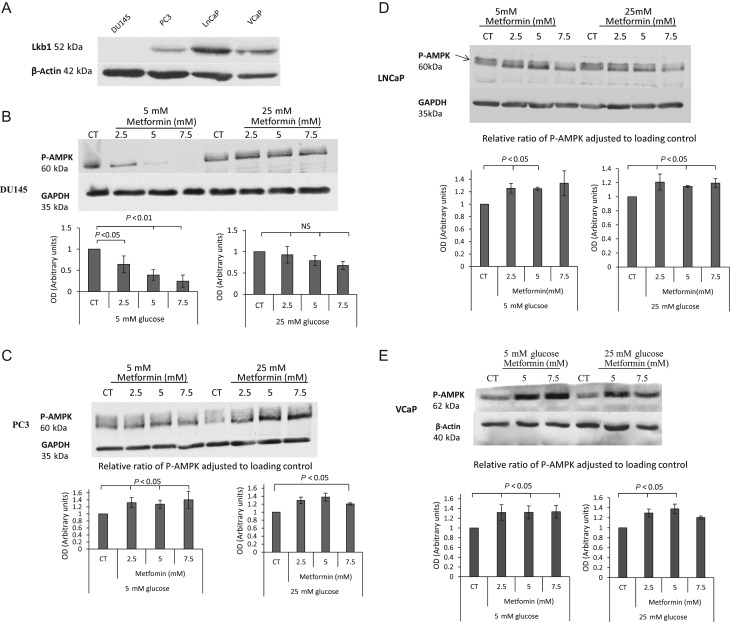
Figure 4.
(A) DU145, PC3, LNCaP and VCaP PCa cell lines were screened for abundance of LKB1 protein. Cells were grown in growth media and whole-cell lysates were prepared and subjected to Western blotting. (B) Changes in p-AMPK levels after metformin (2.5–7.5 mM) treatment. DU145 cells were seeded in 5 mM glucose for 24 h, which was replaced with either 5 mM or 25 mM SFM for a further 24 h. Cells were then treated with metformin (2.5–7.5 mM) for 24 h and whole-cell lysates were prepared and subjected to Western blotting. 50 µg of protein were loaded onto a 10% gel. (C) Shows levels of p-AMPK in PC3 cells exposed to metformin (2.5–7.5 mM) treatment. Cells were set up as described in Fig. 4B. (D) Shows levels of P-AMPK in LNCaP cells exposed to metformin (2.5 and 5 mM) treatment. Cells were set up as described in Fig. 4B. (E) Shows levels of p-AMPK in VCaP cells exposed to metformin (5 and 7.5 mM) treatment. Each blot is representative of experiments repeated three times, and the densitometry shows the changes of p-AMPK adjusted to loading control for all experiments (n = 3).

 This work is licensed under a