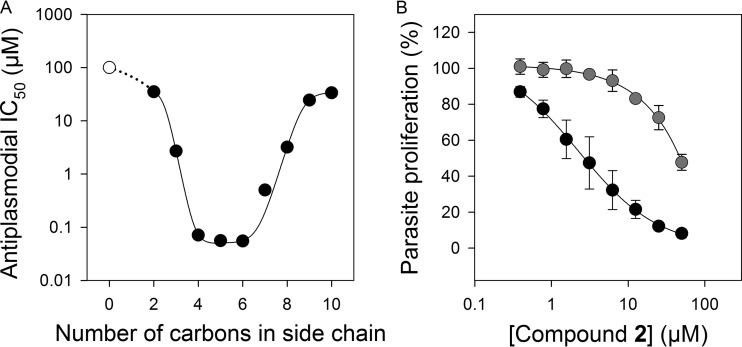
FIG 4.
(A) Relationship between the length of the hydrocarbon side chain (at the R position) of compounds 1a to j and their antiplasmodial IC50s. The IC50 for compound 1a (white symbol) could not be determined because it is higher than the highest concentration tested (100 μM), which had <10% inhibitory effect. The assay was carried out in the presence of pantetheinase activity and 1 μM pantothenate. (B) In vitro antiplasmodial activity of compound 2. Dose-response relationship of compound 2 in the presence (black circles) of pantetheinase. The effect of increasing the concentration of pantothenate (from 1 μM to 100 μM) in the presence of pantetheinase on the antiplasmodial activity of compound 2 was also tested (gray circles). Values are means from three or more independent experiments, each carried out in triplicate. Where not shown, the error bars (SEM) are smaller than the symbols.

