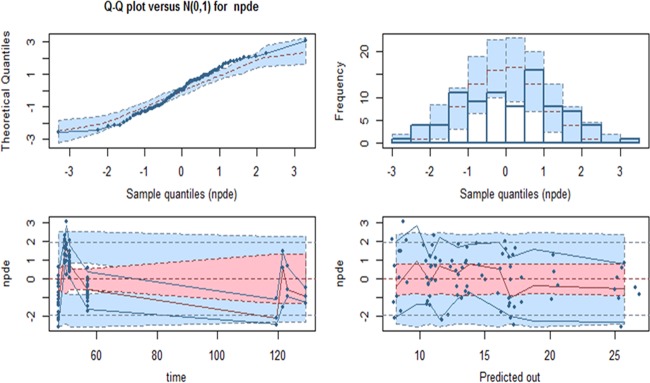
FIG 2.
Quantile-quantile (Q-Q) plot (top left) of the nonparametric distributional error (npde) versus the corresponding quantiles of a normal distribution [N(0,1)], and histogram (top right) of the npde showing symmetric light tailed distributions centered at zero. The nonparametric distributional error versus time (in hours) of the sample and predicted out (micafungin concentrations in mg/liter) is shown, with horizontal lines representing the −2, 0, and +2 standard deviations for the ideal normal distribution and the 95% error, shown by the bottom blue, pink, and top blue regions, respectively.

