
FIG 1.
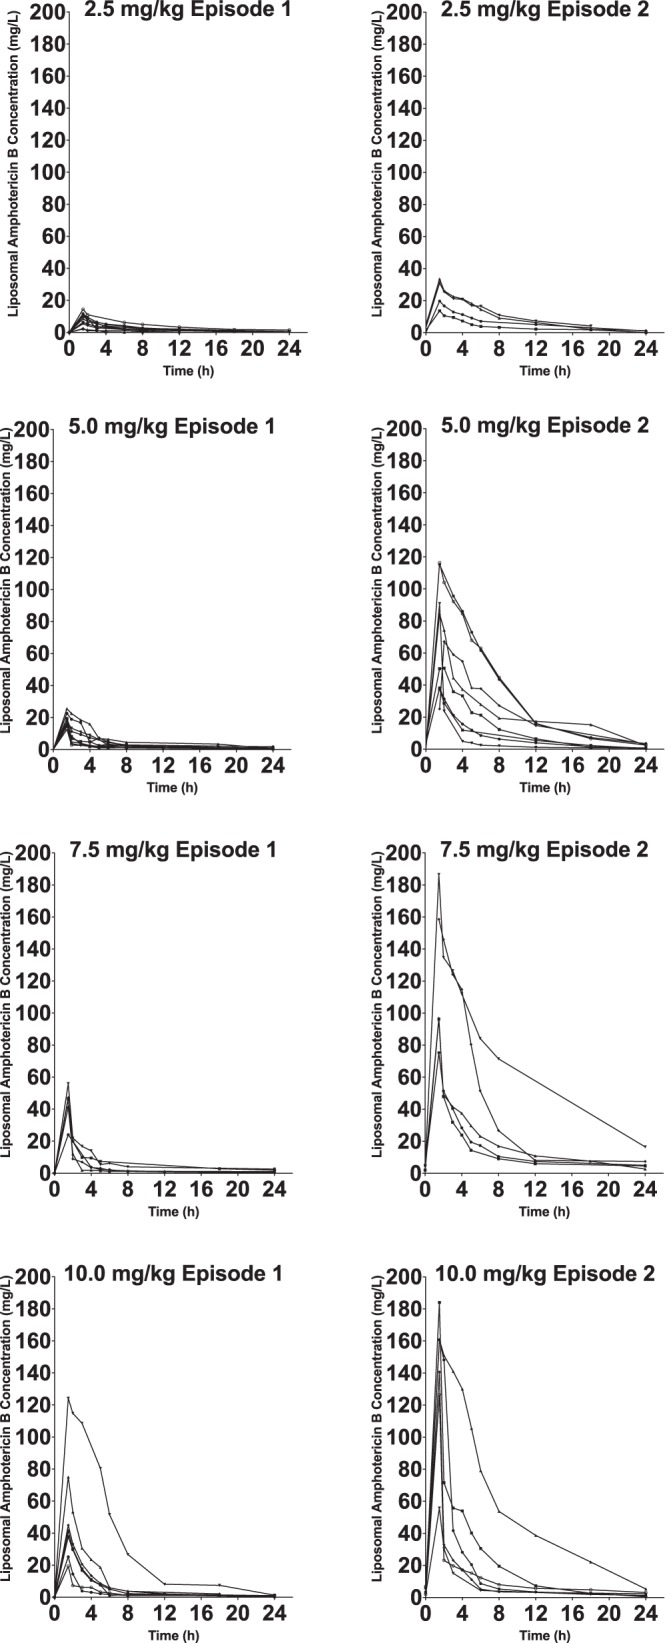
Concentration-time profiles for each patient on day one of therapy (n = 35) and at completion of therapy (n = 25). Closed circles are the raw pharmacokinetic data from each patient.
Official websites use .gov
A
.gov website belongs to an official
government organization in the United States.
Secure .gov websites use HTTPS
A lock (
) or https:// means you've safely
connected to the .gov website. Share sensitive
information only on official, secure websites.
Concentration-time profiles for each patient on day one of therapy (n = 35) and at completion of therapy (n = 25). Closed circles are the raw pharmacokinetic data from each patient.