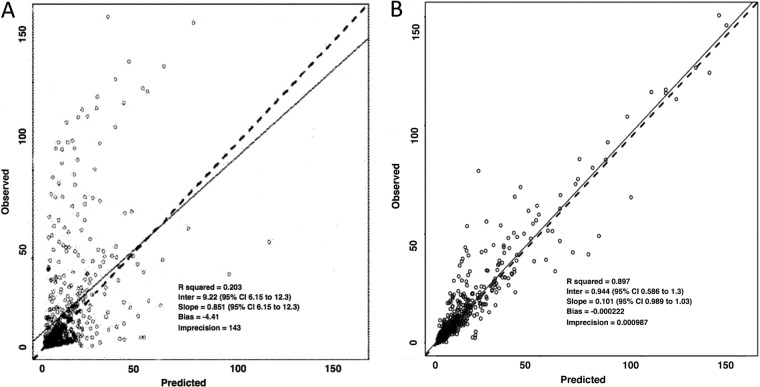
FIG 2.
Scatter plots showing observed versus predicted values for population pharmacokinetic models after the Bayesian step with a standard 2-compartment model (A) and selected model (B). Open circles, dashed lines, and solid lines represent individual observed-predicted data points, line of identity, and the linear regression of observed-predicted values, respectively.

