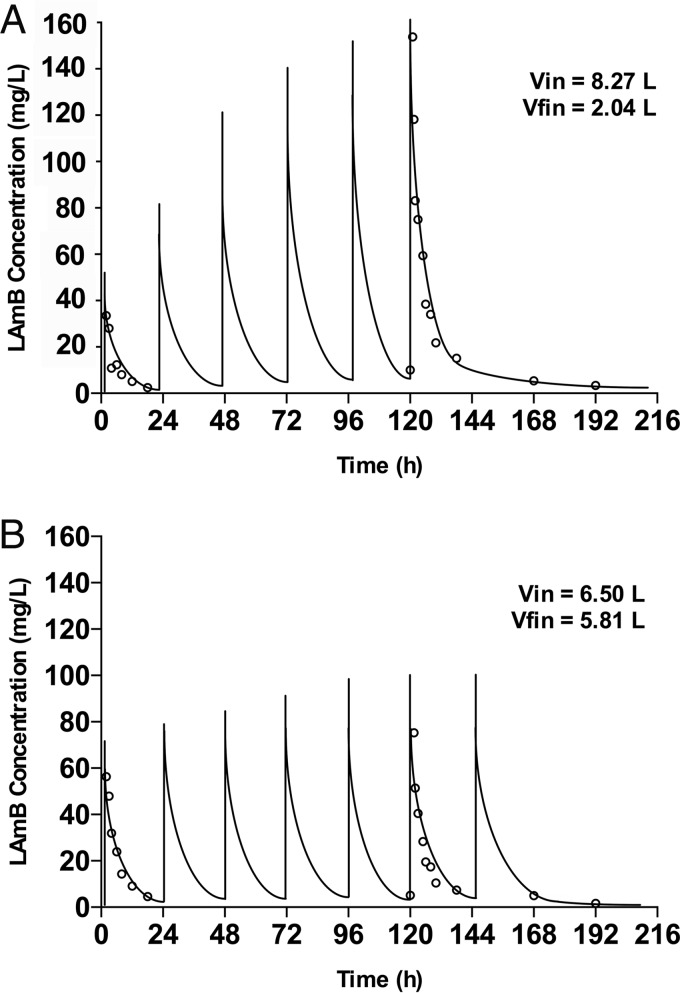
FIG 3.
Concentration-time profiles for two patients receiving LAmB (10 mg kg−1). Initial (Vin) and final (Vfin) estimates for volume of distribution (V) are shown. Open circles and solid lines represent the raw data and simulated concentration-time profiles for each patient, respectively. Patient A exhibits evolving PK with a contraction in the V, while patient B exhibits stable V.

