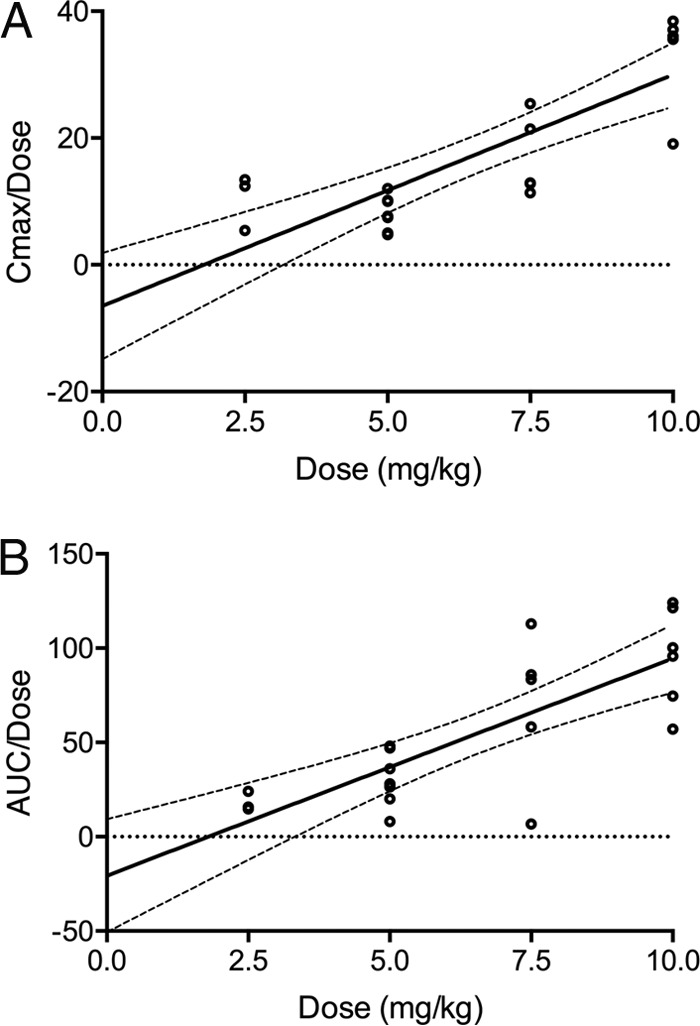
FIG 4.

Comparisons of dose-normalized Cmax (A) and AUC0–24 (B) at steady state with respect to dose per unit of weight. Solid and dashed lines represent linear regression and 95% confidence intervals, respectively.

Comparisons of dose-normalized Cmax (A) and AUC0–24 (B) at steady state with respect to dose per unit of weight. Solid and dashed lines represent linear regression and 95% confidence intervals, respectively.