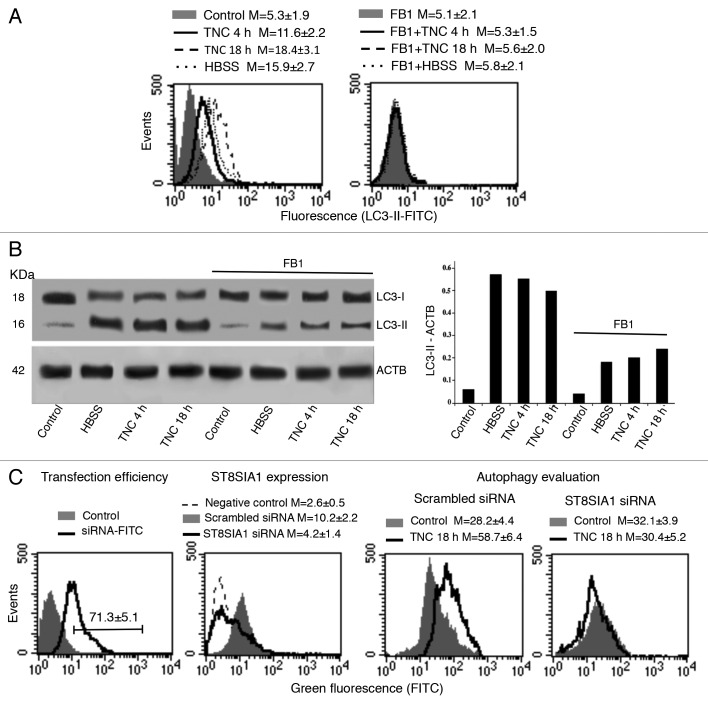
Figure 2. Engagement of sphingolipids in the autophagic process. (A) Semiquantitative flow cytometry analysis of autophagy performed after human fibroblast staining with anti-LC3-II antibody. The numbers represent the mean ± SD of the median fluorescence intensity obtained in 3 independent measurements. A representative experiment is shown. (B) Human fibroblasts, untreated or treated with TNC (5 µM for 4 h or 18 h at 37 °C) or HBSS, in the presence or in the absence of pretreatment with FB1, were analyzed by western blot using anti-LC3 polyclonal antibody. Loading control was evaluated using anti-ACTB Mab (left panel). Densitometric LC3-II-ACTB ratios are shown (right panel). (C) In the first panel cytofluorimetric analysis of fluorescence emission in fibroblasts transfected with FITC-siRNA is shown. The percentage of FITC-positive cells was considered indicative of the transfection efficiency. The number represents the mean percentage ± SD of FITC-positive cells (corresponding to transfected cells) obtained in 3 independent measurements. In the second panel cytofluorimetric evaluation of ST8SIA1 expression level 48 h after siRNA transfection is shown. The numbers represent the mean ± SD of the median fluorescence intensity obtained in 3 independent experiments. A representative experiment is shown. In the third and fourth panels a semiquantitative flow cytometry analysis performed by Cyto-ID Autophagy detection kit of autophagy induced by TNC in cells knocked down for ST8SIA1 (fourth panel) or in cells transfected with scrambled siRNA (third panel) is shown. The numbers represent the mean ± SD of the median fluorescence intensity obtained in 3 independent measurements. A representative experiment is shown.

An official website of the United States government
Here's how you know
Official websites use .gov
A
.gov website belongs to an official
government organization in the United States.
Secure .gov websites use HTTPS
A lock (
) or https:// means you've safely
connected to the .gov website. Share sensitive
information only on official, secure websites.
