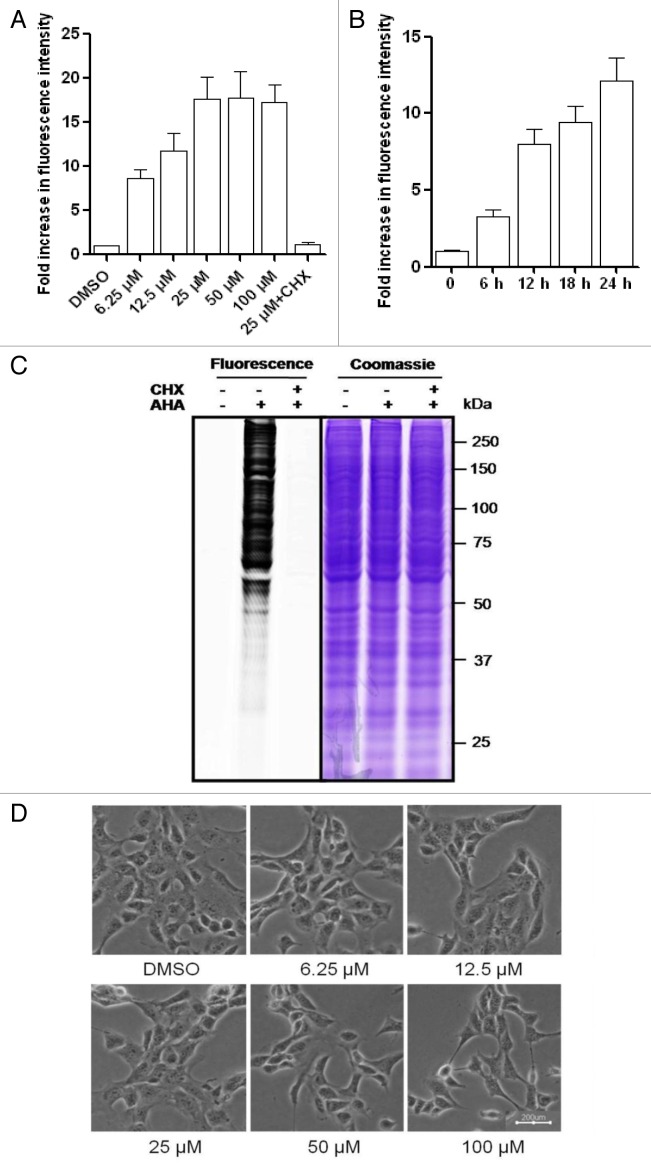
Figure 1. Dose- and time-dependent metabolic labeling of AHA in MEFs. (A) MEFs were treated in l-methionine-free medium with different dosages of AHA for 18 h. Cell were then cultured in regular DMEM with 10× l-methionine (2 mM) for 2 h. Finally, the cells were harvested, fixed, and permeabilized for the click reaction, as described in Materials and Methods. (B) MEFs were labeled with 25 μM AHA at different time points (6, 12, 18, and 24 h) and cellular fluorescence intensity was analyzed as described. (C) Visualization of AHA-labeled proteins. MEFs were labeled with AHA (25 μM × 18 h) and then the cells were harvested for click tagging and in-gel fluorescence scanning. Coomassie staining was used to show the equal protein loading. Cycloheximide (CHX, 10 μg/ml) was added to inhibit de novo protein synthesis and the cells cultured in regular DMEM were used as the negative control. (D) Morphological changes of MEFs with different dosages of AHA labeling were examined and photographed with an inverted microscope (scale bar: 200 μm).

An official website of the United States government
Here's how you know
Official websites use .gov
A
.gov website belongs to an official
government organization in the United States.
Secure .gov websites use HTTPS
A lock (
) or https:// means you've safely
connected to the .gov website. Share sensitive
information only on official, secure websites.
