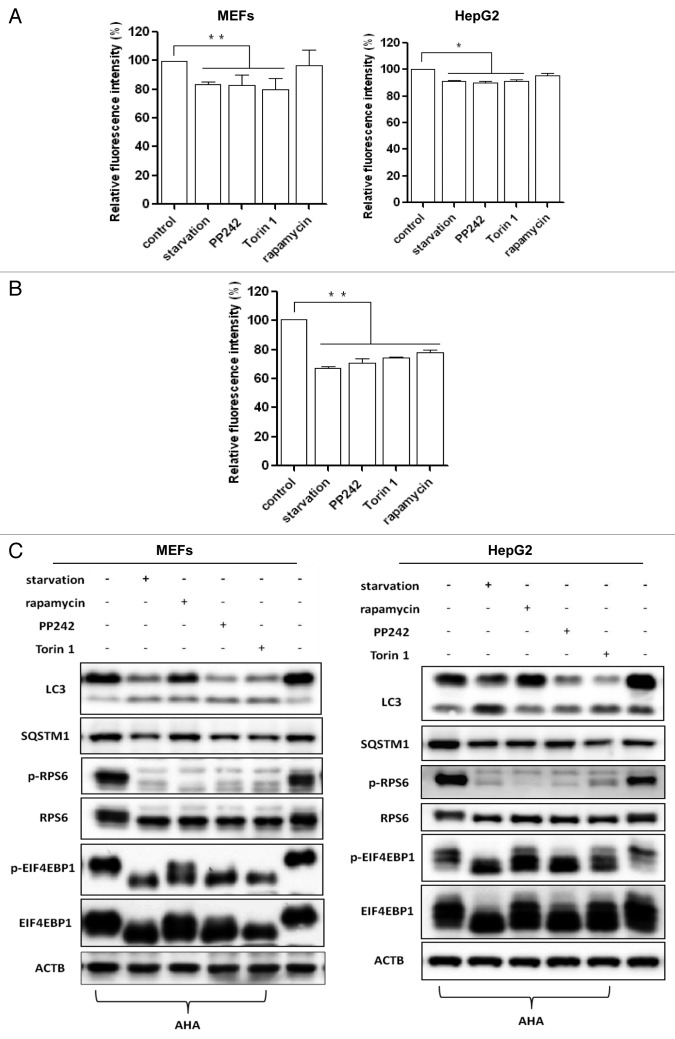
Figure 2. Autophagy induction increased long-lived protein degradation. (A) Cells were first labeled with AHA as described, and then the cells were cultured in starvation medium or treated with MTOR inhibitors (rapamycin, 1 μM; PP242, 1 μM; or Torin 1, 1 μM) for 3 h. Left panel for MEFs; right panel for HepG2 cells. Data for the relative signal intensity were expressed as the ratio of treated cells to control cells, as mean ± SD from 3 independent experiments, *P < 0.05, **P < 0.01, the Student t test. (B) MEFs were subjected to starvation or treated with MTOR inhibitors for 6 h and cellular fluorescence intensity was measured. (C) MEFs and HepG2 cells were treated as in (A) and cell lysates were prepared for western blot. ACTB/β-actin was used as the loading control.

An official website of the United States government
Here's how you know
Official websites use .gov
A
.gov website belongs to an official
government organization in the United States.
Secure .gov websites use HTTPS
A lock (
) or https:// means you've safely
connected to the .gov website. Share sensitive
information only on official, secure websites.
