
Figure 13. Lithocholic acid induces mitochondrial dysfunction in PC-3 and DU-145 cells.
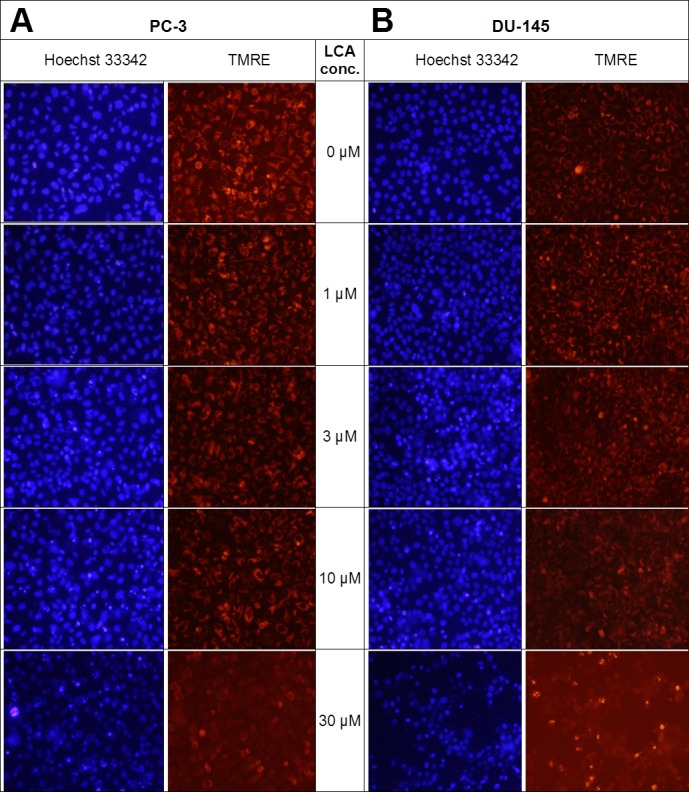
Cells were exposed to different concentrations of LCA for 8 h. Apoptotic nuclear morphology (chromatin condensed nuclei) was observed by Hoechst 33342 staining and mitochondrial membrane permeability was measured using TMRE fluorescent dye by fluorescence microscopy. The concentration–response experiment was performed three times using different cell passages; per experiment, each concentrations was tested in triplicate.