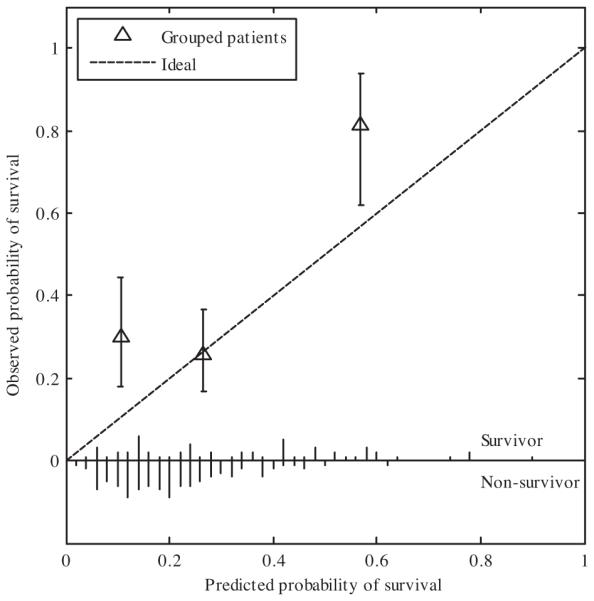
Fig. 3.

Calibration plot of the DSS for the clinical cohort using three prognosis groups. Each point represents the predicted and observed probability for the group. The error bar is the 95% confidence interval. On the axis the number of survivors and non-survivors are shown per 2% interval predicted probability. The calibration curve of the medium prognosis group is not different from the ideal curve, in the good and poor prognosis group a higher than predicted survival is observed.
