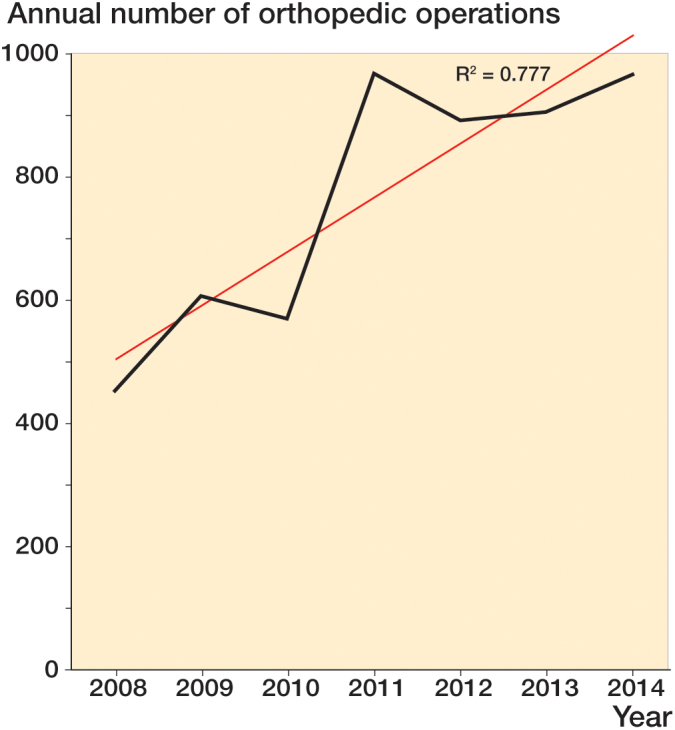
Figure 3.

The annual number of orthopedic operations performed at KCH from 2008 through 2014 (black) shows a rapid increase in surgical activity after international support for the KCH surgery training program started in 2008, but this appears to have reached a plateau from 2011 onwards due to the availability of only 1 theater. The regression-line estimation (red) shows a statistically signifi cant increase in surgical activity over the whole period (p = 0.009).
