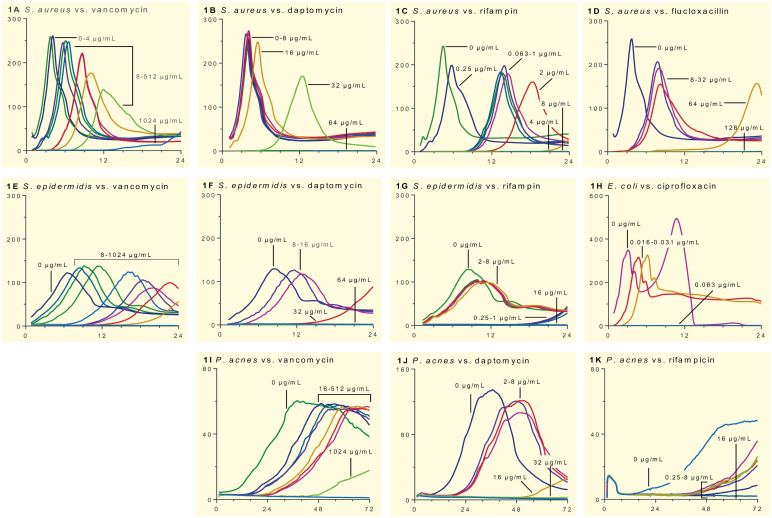
Figure 1.
Heat flow (y-axis, μW) development over time (x-axis, hours) of S. aureus (panels A–D), S. epidermidis (E–G), E. coli (H), and P. acnes (I–K) exposed to different antibiotics. The numbers above each curve indicate the respective antibiotic concentrations. The range for x-axis is different in the case of P. acnes (72 h). Furthermore, y-axis range was changed for non-staphylococci that showed markedly different heat flow levels. The positive controls were biofilms on beads not previously exposed to antibiotics (0 μg/mL). The experiments were performed in triplicate, and a representative experiment is shown.

