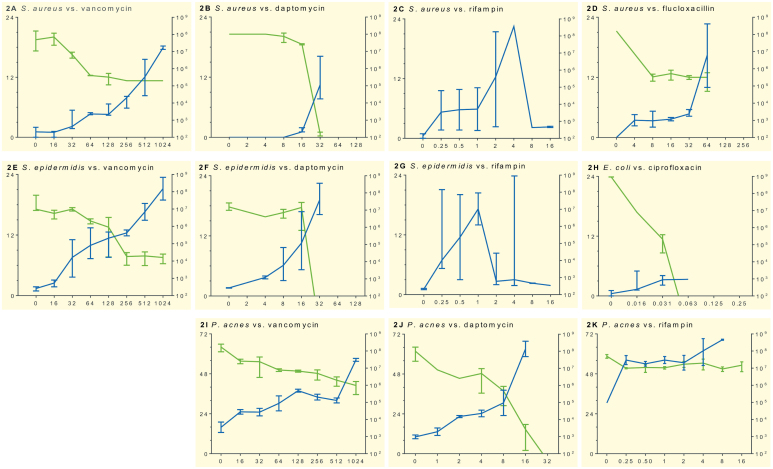
Figure 2.
Growth inhibition of various antibiotics on S. aureus (panels A–D), S. epidermidis (E–G), E. coli (H), and P. acnes (I–K) in sonication fluid, determined by microcalorimetry and culture. The x-axis shows increasing antibiotic concentrations (μg/mL). The green line represents median bacterial concentration (corresponding to y-axis on right, in CFU/mL) determined by viable count in 3 independent experiments; bars indicate range. The blue line represents median time to detection (corresponding to y-axis on left, in hours) in the microcalorimeter experiment. It demonstrates how significant bacterial heat flow (> 10 μW) is detectable within a few hours. Spontaneous emergence of staphylococcal resistance to rifampin was observed in replicates of experiments C and G.

