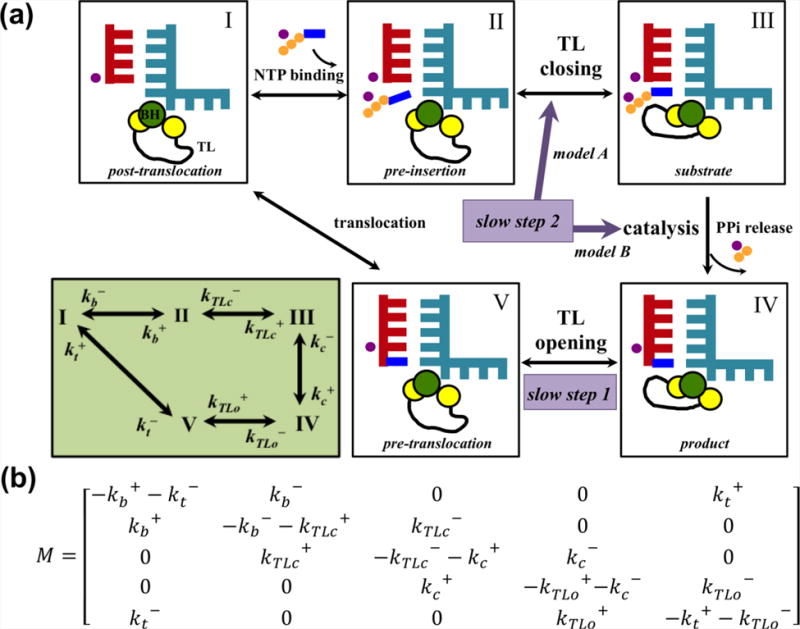
Figure 5. Elucidation of the overall dynamics of the NAC by KNM.

(a) A five-state KNM provides explanations to the two slow steps in transcriptional elongation: slow step 1 is assigned to the TL opening, whereas two scenarios are possible for the slow step 2: TL closing (model A: II to III) or pre-catalytic conformational rearrangement (model B: III to IV). The lower left panel shows the transition rates between states. The state definition here is consistent with that in Figure 1, but the backtracking state is not included in this model. (b) The transition rate matrix for the five-state KNM.
