
Figure 3. Frequency of Detection of Genera and Significant Species Between Response Groups.
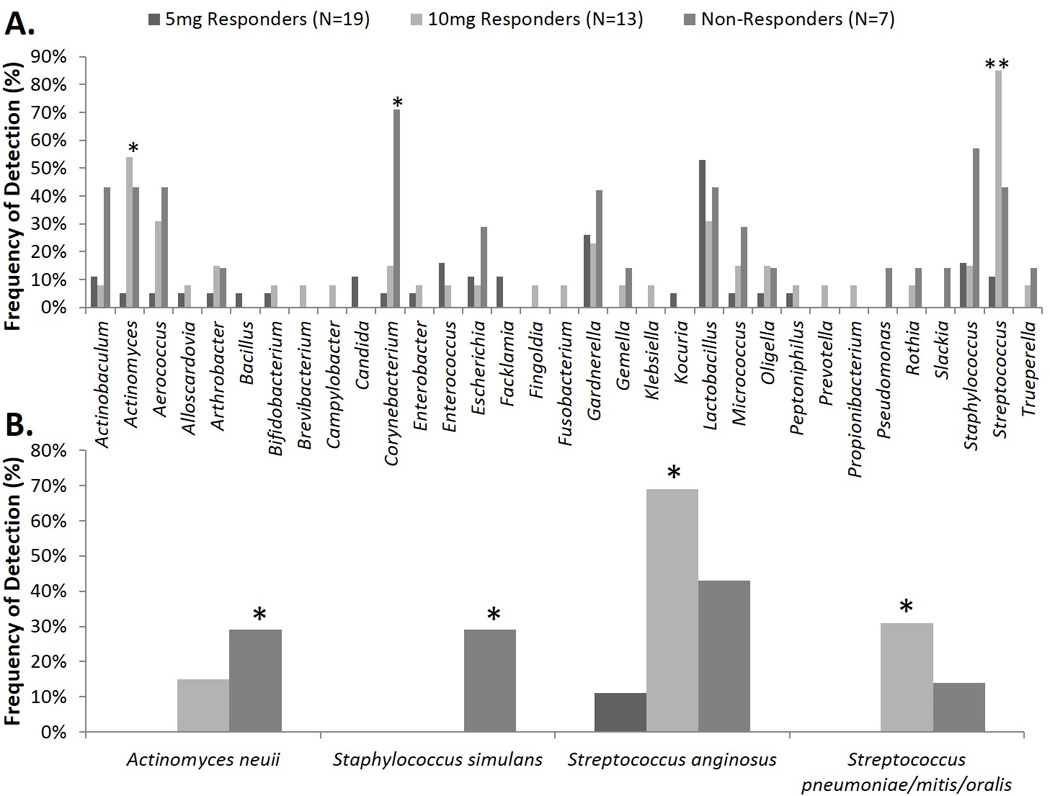
Comparison of the frequency of culture-based detection at the genus (A) and species level (B) for baseline urines by response group. Fisher’s Exact Test was used to calculate the p-values. * p=0.05 ** p=0.00