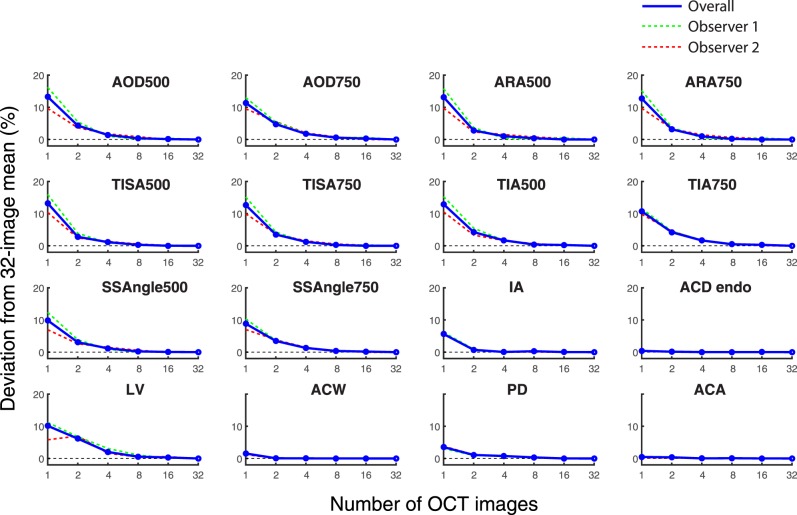
Figure 4.
Deviations of measurement value means for an increasing number of images. The deviations of mean values obtained from an increasing number of images compared to 32-image values are plotted for 16 anterior segment parameters. Both the overall deviations (red lines) and the individual observer deviations (green line is observer 1; red line is observer 2) are shown. As the number of OCT images increased for AOD, ARA, TISA, TIA, SSAngle, IA, and LV, deviations of the mean values decreased. Deviation values were minimal for ACD, ACW, PD, and ACA, even when one OCT image was analyzed.

