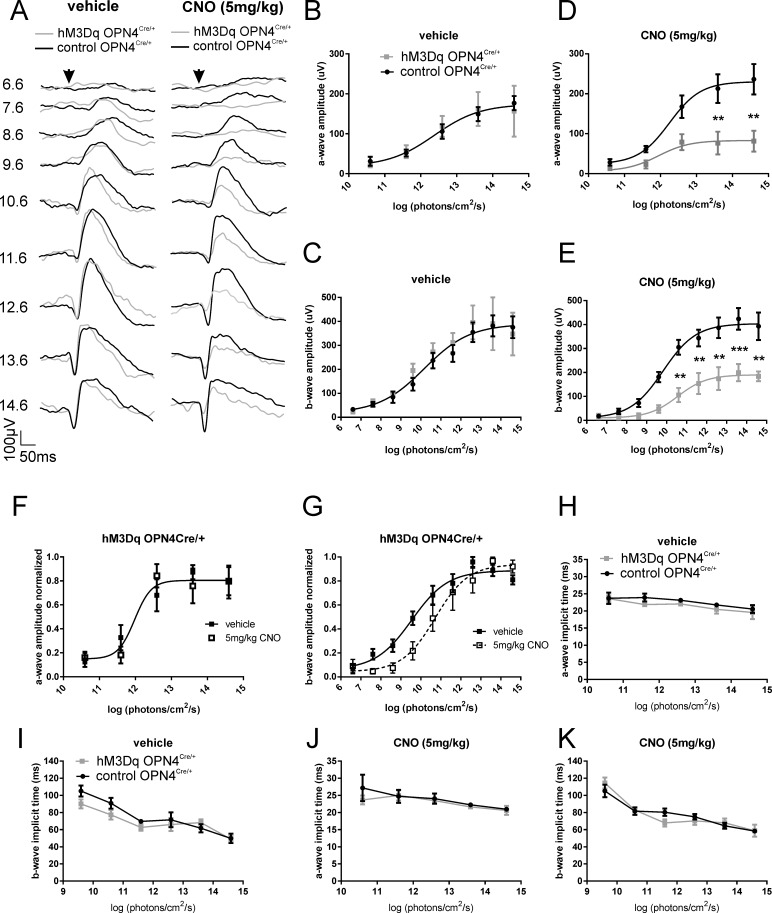
Figure 2.
Chemogenetic activation of ipRGCs affects scotopic ERG. (A) Dark-adapted flash ERG recordings from representative hM3Dq Opn4Cre/+ (gray trace) and control Opn4Cre/+ (black trace) mice before (vehicle; left) and after CNO intraperitoneal injection (5 mg/kg; right). Arrow depicts flash onset. Scale bars: 50 ms (x-axis), 100 μV (y-axis). Numbers at right are total log photons/cm2/s. (B) Mean (±SEM) a-wave amplitudes from hM3Dq Opn4Cre/+ (gray squares) and control Opn4Cre/+ (black circles) mice before and (D) after CNO injection. Best fit with one curve (F test: P = 0.96) for (B) but not for (D) (F test: P < 0.0001). (C) Mean (±SEM) b-wave amplitudes from hM3Dq Opn4Cre/+ (gray squares) and control Opn4Cre/+ (black circles) mice before and (E) after CNO injection. Best fit with one curve (F test: P = 0.67) for (C) but not for (E) (F test: P < 0.0001). (F) Normalized a-wave amplitudes from hM3Dq Opn4Cre/+ mice before (vehicle; filled squares) and after CNO injection (open squares) (F test: P = 0.91). (G) Normalized b-wave amplitudes from hM3Dq Opn4Cre/+ mice before (vehicle; filled squares) and after CNO injection (open squares) (F test: P = 0.004). (H) Mean (±SEM) a-wave implicit time from hM3Dq Opn4Cre/+ (gray squares and line) and control Opn4Cre/+ (black circles and line) mice before and (J) after CNO injection (5 mg/kg). (I) Mean (±SEM) b-wave implicit time from hM3Dq Opn4Cre/+ (gray squares and line) and control Opn4Cre/+ (black circles and line) mice before and (K) after CNO injection (5 mg/kg); n = 4 for hM3Dq Opn4Cre/+; n = 5 for control Opn4Cre/+ mice. 2-way ANOVA with post hoc Bonferroni corrections: *P < 0.05, **P < 0.01, ***P < 0.001. CNO, clozapine N-oxide.

