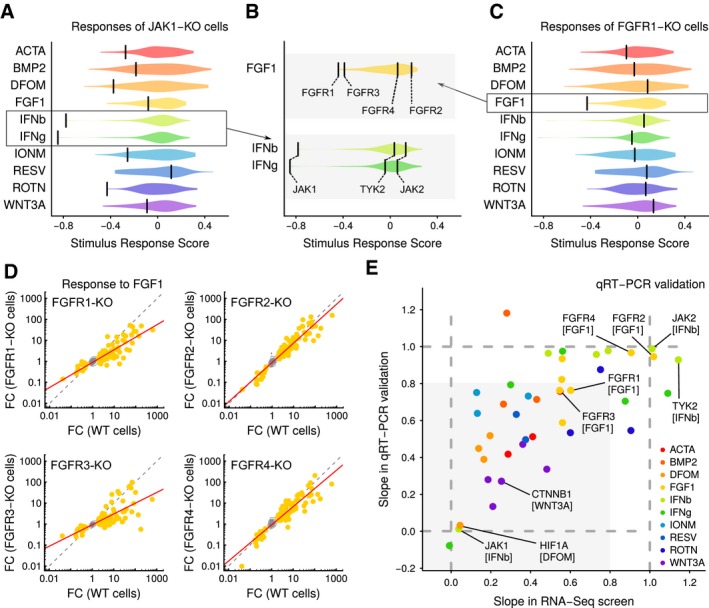
Figure 3. Transcriptional profiling of kinase knockouts links genotypes to pathways.

- Responses of JAK1‐KO cells to the ten selected stimuli. Violins indicate score distributions of all knockout cell lines. Scores are overlaps of signature gene sets with expected signature sets, corrected for technical variables using general linear models. Bars represent scores for JAK1‐KO mutants. KO, knockout.
- Similar as in Fig 3A, except showing detailed view of responses to FGF1 and IFNb/IFNg stimulation of selected knockout cells. Bars indicate labeled mutants of FGFR and JAK family members.
- Same as in Fig 3A, except showing FGFR1‐KO cell line.
- Comparison of response signatures in wild‐type and FGFR‐KO mutant cells. Contours summarize genes that are not differentially expressed; dots indicate FGF1 signature genes; gray dotted line is the diagonal of equal response; and red line is a linear fit using signature genes. FC, fold change; WT, wild type; KO, knockout.
- Comparison of stimulus response as measured by RNA‐seq and qRT–PCR. Each axis shows the slope of a best‐fit line through KO and WT stimulus responses (lines for RNA‐seq are as in Fig 3D, and lines for qRT–PCR data are computed similarly from independent stimulation and qRT measurements). Dotted lines are guides representing unit slope (equal response in KO and WT cells to stimulus) and zero slope (KO cells fully unresponsive to stimulus). Shaded area represents the space where both assays indicate that KO cells are less responsive than WT cells. WT, wild type; KO, knockout.
