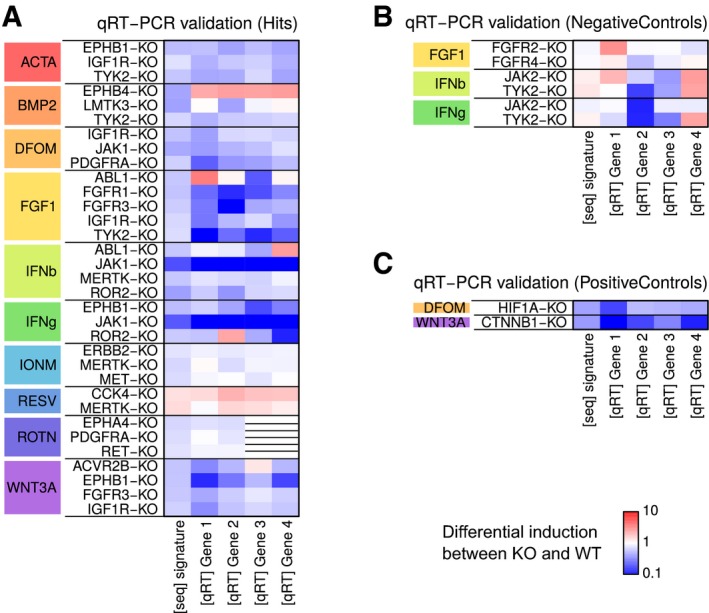
Figure EV5. qRT–PCR validation of selected mutants.

- Heatmap of differential induction of signature genes upon stimulation. Each row represents an independent experiment in which WT and KO cells were stimulated, and the expression of four genes measured using qRT–PCR. Similar induction levels in the four genes and in the RNA‐seq signature conveys concordant results between the PCR and sequencing assays. WT, wild‐type; KO, knockout.
- Same as in (A) except for KO and stimulus combinations for expected negative interactions.
- Same as in (A) except for KO and stimulus combinations for expected positive interactions.
