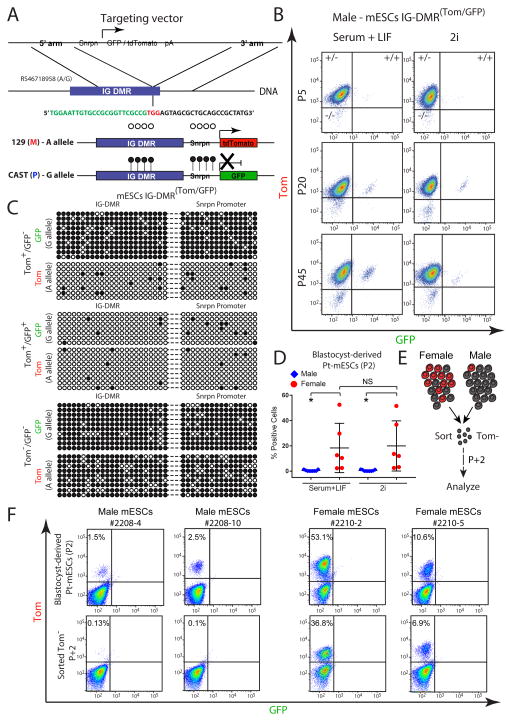
Figure 1. Allele-specific targeting of the Dlk1-Dio3 IG-DMR.
(A) Schematic representation of CRISPR/Cas-mediated allele-specific targeting of Snrpn-GFP or Snrpn-Tom, adjacent to the IG-DMR region; green sequence - endogenous IG-DMR region; black sequence - targeting CRISPR; red sequence - PAM recognition site.
(B) Flow cytometric analysis of GFP/Tom reporter ES cells at different passages, cultured in serum+LIF or 2i.
(C) Allele-specific bisulfite sequencing was performed on sorted mES IG-DMR Tom+/GFP−, IG-DMR Tom+/GFP+ and Tom−/GFP− cells. Each row represents a distinct PCR amplicon (marked with dashed line) that includes the endogenous IG-DMR (left) and the downstream integrated Snrpn promoter region (right); open circles – unmethylated CpGs; black circles – methylated CpGs.
(D) Dot plot showing the percentage of GFP/Tomato positive cells in passage 2 (P2) male and female mESCs cultured in Serum+LIF or 2i, as measured by flow cytometry. Black lines indicate mean ± SD for each group. Statistical differences between genotypes were calculated using one-way ANOVA; * P<0.05; NS – not significant; Pt - paternally transmitted.
(E) Schematic diagram for sorting and analyzing paternally transmitted (Pt) Tomato negative (Tom−) male or female mESCs presented in (F).
(F) Flow cytometric analysis of the proportion of Tom-positive cells in passage 2 (P2) male and female mESCs (upper panel) and in sorted Tom− cells following two consecutive passages (lower panel). Pt - paternally transmitted.

