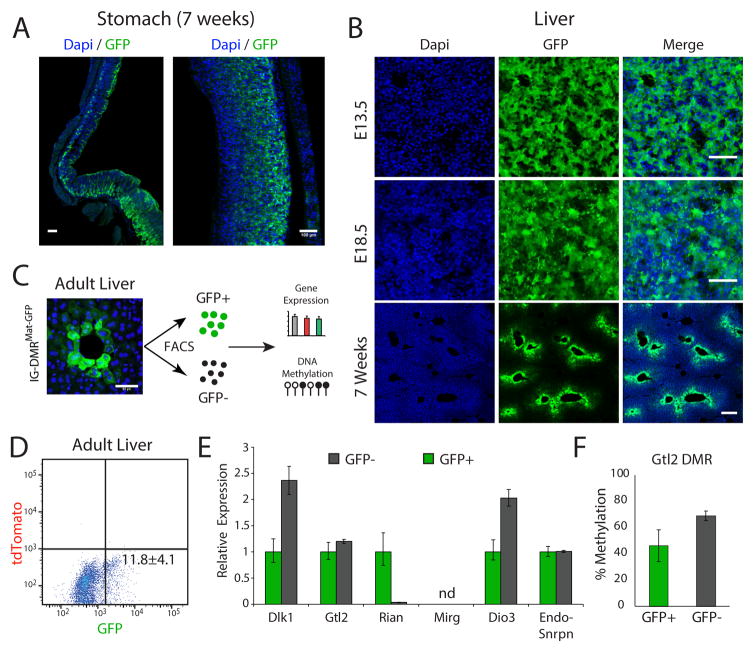
Figure 4. Heterogeneous reporter activity in adult IG-DMRGFP/Mat tissues.
(A) Whole-mount stitching (left) and region specific (right) images of Dapi and anti-GFP staining in adult stomach sections; bar = 100μm.
(B) Representative images of Dapi and anti-GFP staining in liver sections of embryos and adults; bar=50μm.
(C) Single-cell suspension was established from 5 weeks old IG-DMRMat-GFP liver tissues, following cell sorting and DNA/RNA extraction; bar = 50μm.
(D) Flow cytometric of GFP positive cells, mean ± s.d of two independent livers.
(E) qRT-PCR analysis of representative genes in the Dlk1-Dio3 region in sorted IG-DMRMat-GFP liver cells. Shown is mean relative fold change ± s.d of two biological replicates; nd – not detected.
(F) Bisulfite sequencing of Gtl2 promoter DMR in sorted GFP positive and GFP negative IG-DMRMat-GFP liver cells. Shown are mean methylation levels ± s.d of two biological replicates. For each sample, more than 10 amplicons were sequenced to calculate the percentage of methylated CpGs.

