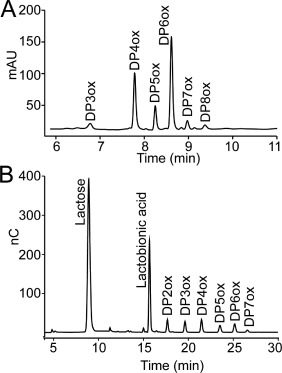
Figure 3.

Product profiles from LPMO‐CDH reactions. Chromatographic analysis of reaction products arising from incubation of 1.5 µM MtCDH and 3.0 mM lactose with (A) 1.0 µM CBP21 and 10 mg/mL β‐chitin or (B) 1.0 µM ScLPMO10C and 10 mg/mL Avicel for 4 h. Both reactions were buffered in 25 mM Bis‐Tris pH 6.0. Peaks are labeled as follows: DP, degree of polymerization; ox, oxidized at C1 (aldonic acids). In‐house made standards were used to verify product identities and product distributions were also verified by MALDI‐TOF MS (not shown). Some (small) peaks in both chromatograms were not possible to identify (unlabeled peaks in the chromatograms) and most likely represent background noise.
