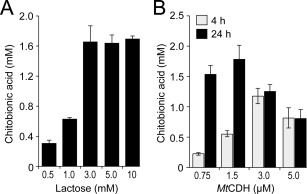
Figure 4.

Dose‐response experiments. Accumulation of oxidized products was measured after 4 h (gray bars, panel B only) and 24 h (black bars). A: Degradation of 10 mg/mL β‐chitin by 1.0 µM CBP21, 1.5 µM MtCDH at varying concentrations of lactose. B: Degradation of 10 mg/mL β‐chitin by 1.0 µM CBP21 in the presence of 3.0 mM lactose and varying concentrations of MtCDH. The standard deviations for all experiments are shown by error bars (n = 3). All reactions (panels A and B) were buffered in 25 mM Bis‐Tris, pH 6.0.
