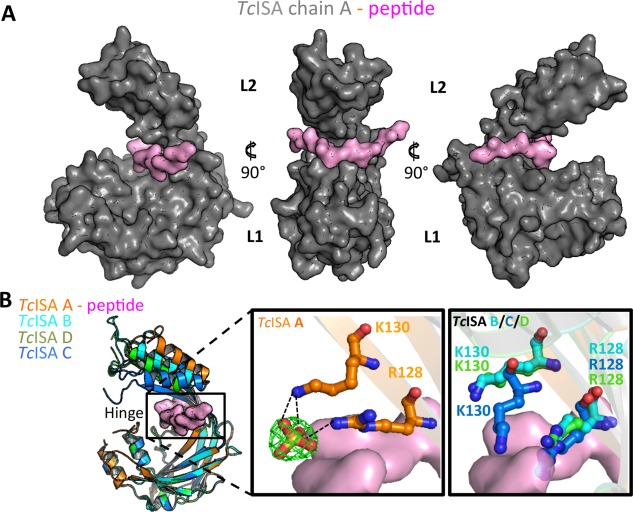
Figure 2.

Hinge region in TcISA reveals the potential for ligand binding. (A) TcISA chain A surface (grey) highlighting the bound peptide (pink). (B) Superimposition of TcISA monomers (left) with cleft indicated by black box. Middle panel: R127 and K130 in the hinge region of chain A coordinating a sulfate group which is depicted as stick model with a 2Fo‐Fc electron density map (green mesh) contoured at 1.5σ. Right panel: R128 and K130 of chains B, C, and D showing steric clash with overlaid peptide from chain A. An interactive view is available in the electronic version of the article.
