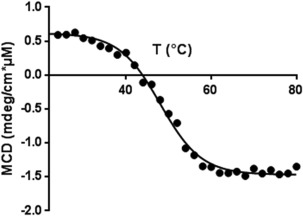
Figure 8.

Thermal denaturation curve of synthetic calstabin. Molar CD of P2 at 202 nm in 20 mM potassium phosphate buffer (pH 7.7) during thermal denaturation at 1°C min−1. The solid line is the theoretical curve fitted to the experimental data points.
