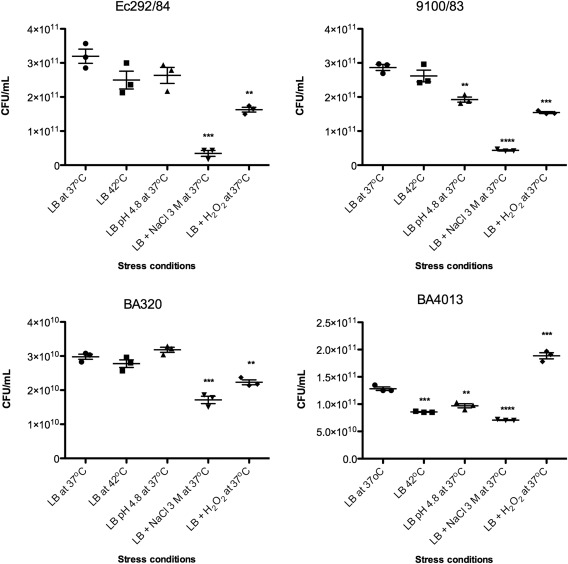
Figure 5.

Stress survival assay. After stressors exposure the aEPEC strains: Ec292/84, 9100/83, BA320 and BA4013 were plated on LB agar and then the CFU were counted. The CFU values from triplicates of three independent experiments were analyzed by Graph Prism® 5.01, using unpaired Student's t‐test. Differences were statistically significant compared the strains incubation in LB at 37oC. **** (P < 0.0001); *** (P = 0.0002 to 0.0008); ** (P = 0.002 to 0.0034) or non‐significant.
