
Fig. 3.
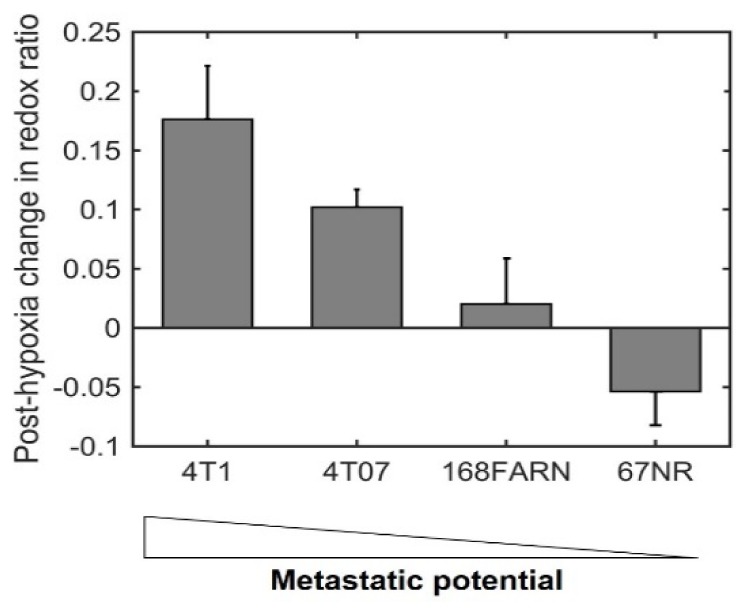
Exposure to acute hypoxia leads to cell-line-dependent changes in redox ratio. Bar plots represent the difference in the mean values of normoxia and post-hypoxia reoxygenation groups. Error bars represent the standard deviation and were calculated as follows:, where sd1 and sd2 represent the normoxia and post-hypoxia groups within each cell line.