
Fig. 5.
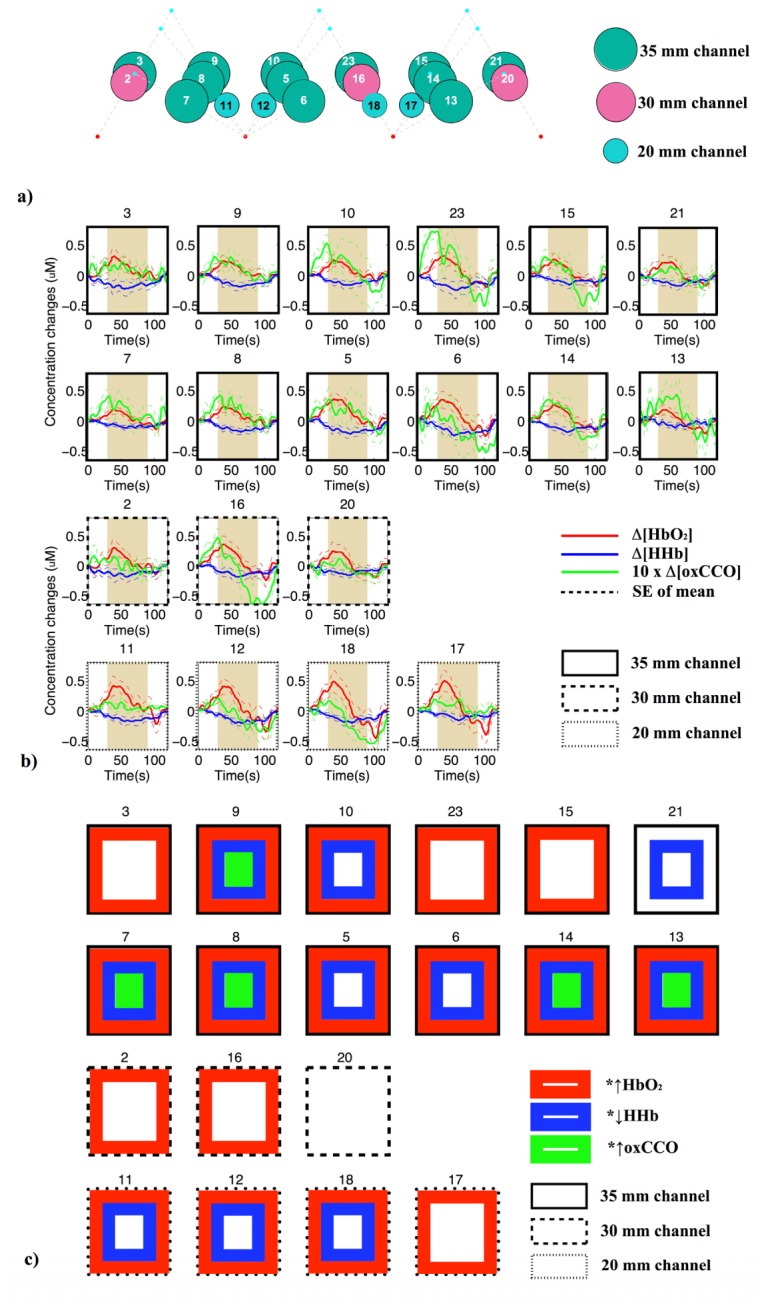
(a) Positions of 19 NIRS measurement channels on the adult forehead. Dark green, magenta and light blue circles indicate channels with SDS of 35 mm, 30 mm and 20 mm respectively. (b) Grand average concentration changes and standard error of mean of HbO2 (red line), HHb (blue line) and 10 x (oxCCO) (green line) among 19 channels across nine subjects during the Stroop task. Plots with solid black borders are from channels with 35 mm separation, dashed black are from channels with 30 mm and dotted ones are from channels with 20 mm separation. The 60 s activation period is indicated by the shaded area. (c) Channels with significant increase in ∆[HbO2] (red squared border), decrease in ∆[HHb] (blue squared border) and increase in ∆[oxCCO] (green squared border).