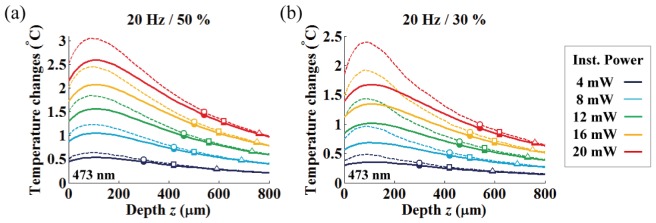
Fig. 11.
Axial temperature variation under various fiber output powers. Each color represents different instantaneous light power used in the range of 4 to 20 mW. Solid and dashed lines represent mean and peak plateau temperature changes, respectively, and the corresponding average power for each duty ratio ((a) 50% / (b) 30%) is shown in Table 2. The round, square and triangle symbols indicate the simulated temperature at the optimized target depth with 10, 5 and 1.3 mW/mm2 threshold criterions, respectively.

