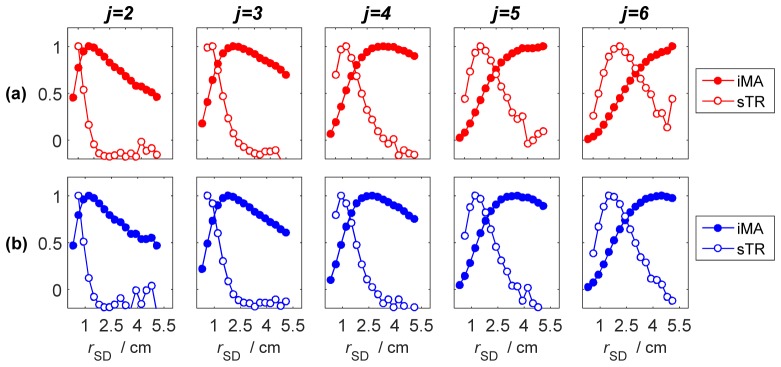
Fig. 2.
Normalized sensitivity factors for (a) mean time-of-flight (MTSF) and (b) variance (VSF). Data are presented for individual layers, denoted by j, of a 10-layer model plotted as a function of source-detector separation. Sensitivity factors were calculated for individual DTOFs (filled circles) and using the moment subtraction approach (open circles, ΔrD = 0.3 cm).

