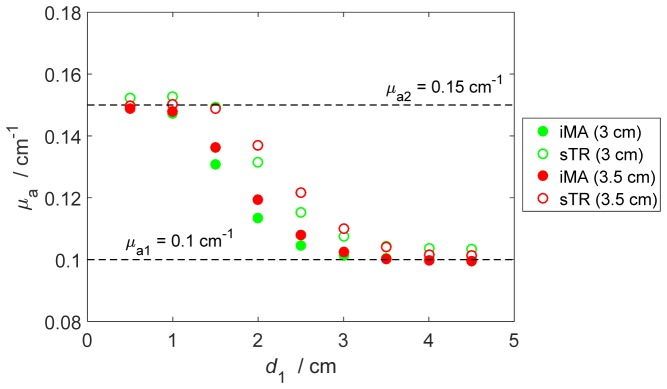
Fig. 4.
Comparison of μa values derived from moment analysis of individual DTOFs (filled circles) and the moment subtraction method (open circles). The calculations were carried out for the model presented in Fig. 1(b) for rSD = 3 cm (green symbols) and rSD = 3.5 cm (red symbols) with ΔrD = 0.5 cm for the sTR method. The true values of μa for the upper (μa1) and lower (μa2) layers were 0.1 and 0.15 cm−1, respectively.

