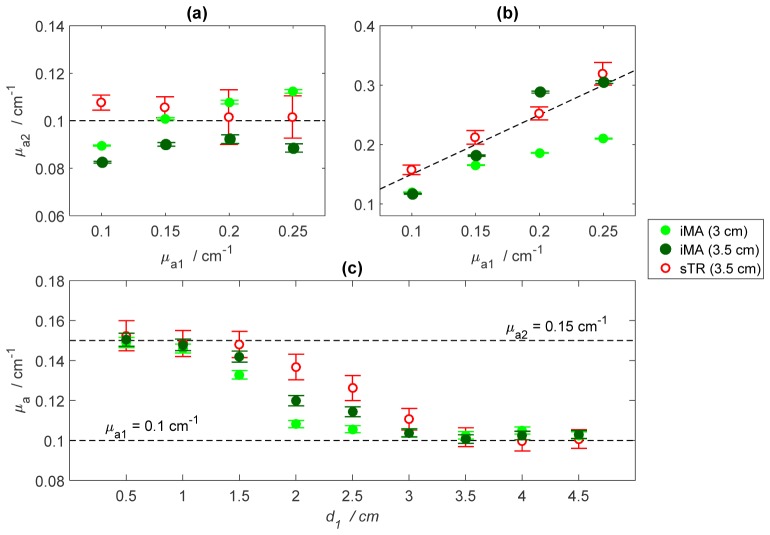
Fig. 6.
Results from the two-layer phantom experiments with absorption changes in (a) the upper layer and (b) the bottom layer. (c) Comparison of μa values obtained from the iMA (filled circles) and sTR (open circles) methods. For the sTR method ΔrD = 0.5 cm, and the iMA method was applied to DTOFs acquired at rSD = 3 cm (green), and rSD = 3.5 cm (dark green). The error bars represent the standard deviation of μa across a series of 200 measured DTOFs.

