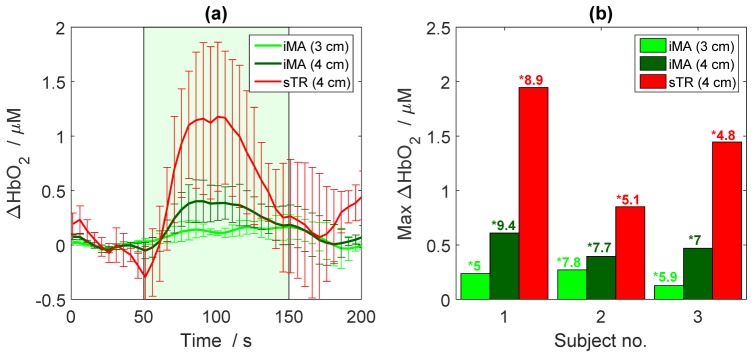
Fig. 8.
(a) Increase in oxyhemoglobin concentration (ΔHbO2) during motor activation determined by iMA applied to each rSD separately (green lines) and by sTR. Time courses are the average across three subjects. The green box represents the stimulation period. (b) Magnitude of the ΔHbO2 for each subject calculated by the iMA and sTR techniques. The CNR of each time course is indicated beside an asterisk (*). The error bars represent the standard deviation of ΔHbO2 across subjects.

