Fig. 1.
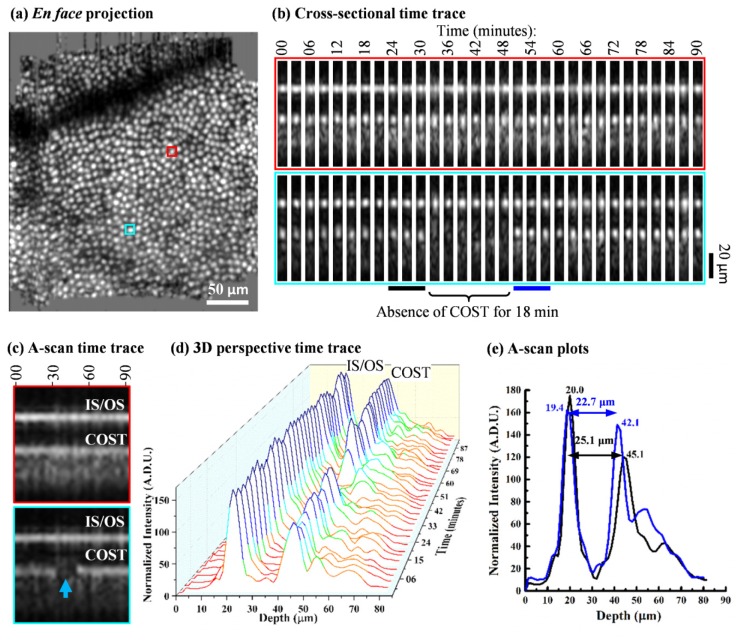
AO-OCT volume time-lapse traces reveal the optical signature of cone shedding, taken from one 90-minute session on subject #2 (see Visualization 1 (1.4MB, AVI) ). (a) Retinal location of the two representative cones are highlighted in red and cyan in the cone mosaic en face projection at 3° temporal. The en face image is a registered and averaged stack of 31 cone image projections from which the representative cone time traces were extracted. (b) Cross-sectional and (c) averaged A-scan time traces are shown for the two representative cones over 90 minutes. Cross sections are 7 µm wide. The red-labeled trace shows the reflectance profile in which both IS/OS and COST reflections remain visible over the session duration. In contrast the cyan-labeled trace shows an abrupt loss of the COST reflection for 18 minutes (minutes 33 to 51) followed by its return, but axially displaced anteriorly. (d) and (e) quantify the OS shortening of the cyan-labeled cone after the 18 minutes loss of the COST reflection. (d) A-scan time trace is shown on a 3D perspective plot. The black and blue bars highlighted in (b) are the three contiguous time points that immediately precede and follow the temporary loss of the COST reflection, respectively. The average of these contiguous time points are plotted in (e). For this disc shedding event, the OS length decreased from 25.1 μm to 22.7 μm.

