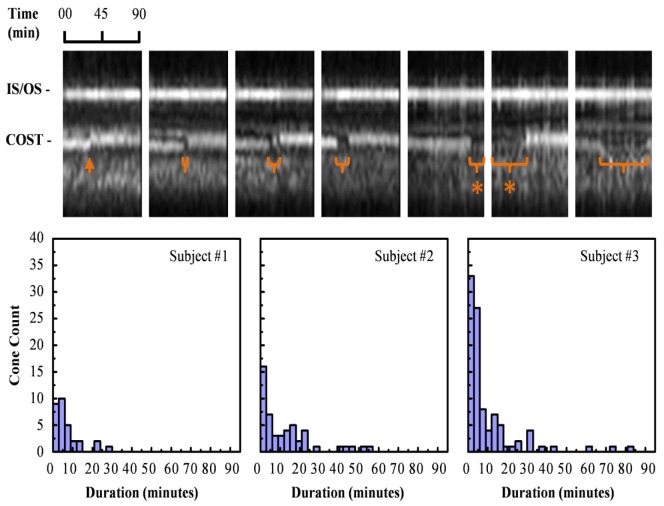
Fig. 2.
Temporary loss of the COST reflection varied in duration depending on cone. (top) Averaged A-scan traces of seven cones in the same 90-minute session depict the extent of the variation: < 3, 6, 12, 15, >18, >42, and 57 minutes. For the two cones labeled with asterisks, the loss of the COST reflection initiated or terminated outside the 90 minute duration of the session. (bottom) Histograms summarize the duration frequency of the loss in the COST reflection for cones in the three morning sessions. For loss durations that extended outside the 90-minute session, we counted the duration to be as long as the portion captured by the experiment, although the actual duration may be longer.

