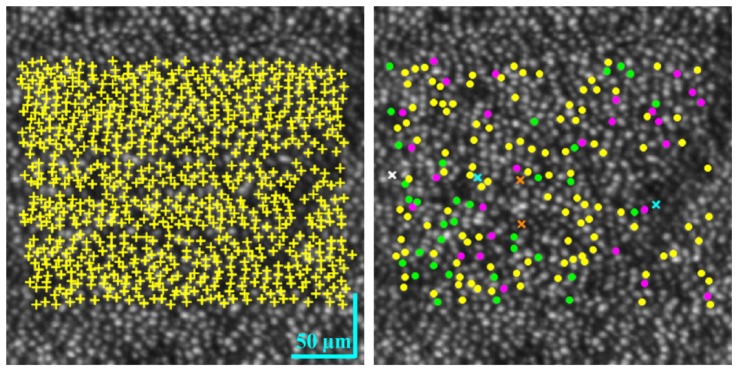
Fig. 5.
Spatial pattern of the 745 tracked cones and 175 detected COST events for the three 90-minute imaging sessions of Subject #3. (left) Tracked cones, common to all three sessions, are superimposed with yellow ‘ + ’ markers in the en face AO-OCT image. Cones that exhibited a single COST event are superimposed with solid circles color coded as yellow (morning), green (afternoon), and magenta (evening). The five cones that exhibited two COST events are superimposed with ‘ × ’ markers color coded as cyan (morning & afternoon), orange (morning & evening), and white (afternoon & evening).

