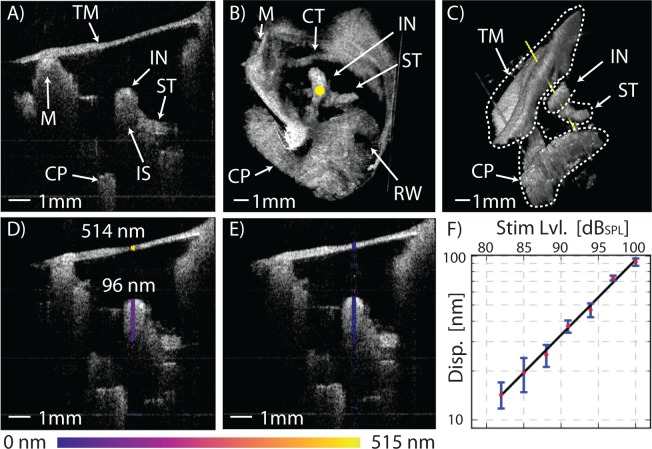
Fig. 5.
In vivo, real-time functional imaging of a normal left ear’s response at 1030Hz. A) Shows a 1 × 1cm2 2D cross-section of the middle ear in the transverse plane. Visualization 3 (15.4MB, AVI) shows the macroscopic changes to the ear anatomy during a Valsalva maneuver. B) Shows a 1 × 1 × 1cm3 3D volume render of the middle ear as seen from the perspective of the ear canal with the TM digitally removed (see Visualization 4 (11.3MB, AVI) ), and C) from an inferior-posterior perspective with the TM in-place showing the axis of Doppler measurement along the yellow line passing through the incus at the stapedius tendon. Functional measurements of the TM and incus’ peak-to-peak vibrational response at 1kHz are shown in D) with a 100dBSPL tone applied to the ear and E) without stimulus. F) A plot of displacement response versus sound pressure level showing excellent linearity from 80dBSPL to 100dBSPL. Error bars represent ± one standard deviation of the response over the pixels along the axial length of the incus. Tympanic membrane (TM), malleus (M), incus (IN), incudo-stapedial joint (IS), stapedius tendon (ST), chorda tympani nerve (CT), cochlear promontory (CP), round-window niche (RW).

