
Figure 3.
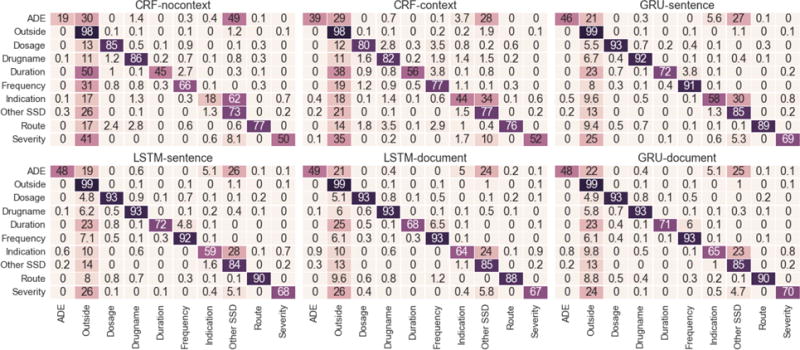
Heat-maps of Confusion Matrices of each method for the different class Labels. Rows are reference and columns are predictions. The value in cell (i, j) denotes the percentage of words in label i that were predicted as label j.
Official websites use .gov
A
.gov website belongs to an official
government organization in the United States.
Secure .gov websites use HTTPS
A lock (
) or https:// means you've safely
connected to the .gov website. Share sensitive
information only on official, secure websites.
Heat-maps of Confusion Matrices of each method for the different class Labels. Rows are reference and columns are predictions. The value in cell (i, j) denotes the percentage of words in label i that were predicted as label j.