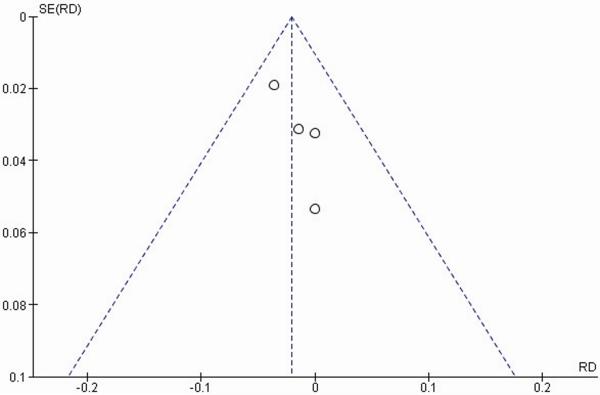
Fig. 3.
Funnel plot of major bleeding events graphically assessing for publication bias. The plot represents the standard error for each study plotted against the measured effect size. The vertical line represents the combined effect for all studies. The diagonal lines represent the 95 percent confidence interval. All studies were confined within the 95 percent confidence interval, suggesting a lack of significant publication bias.

