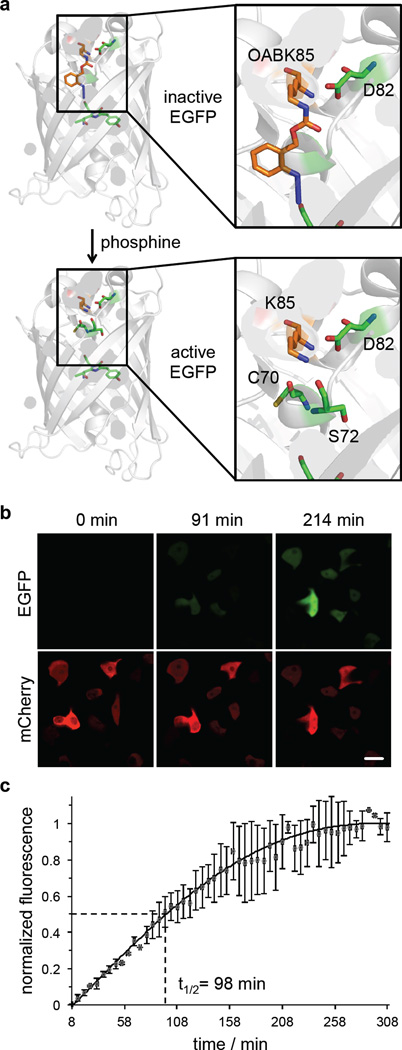
Figure 2. Small molecule-induced activation of EGFP fluorescence.
(a) Incorporation of OABK (0.5 mM) at position K85 of EGFP inhibits fluorophore formation until the native lysine is generated through small molecule activation (model based on PDB 4EUL). (b) Micrographs of HEK293T cells showing EGFP fluorescence only in the presence of the small molecule 2-(diphenylphosphino)benzoic acid (2DPBA, 500 µM), but not in its absence. Scale bar represents 20 µm. (c) Time-lapse imaging and fluorescence quantification indicates a combined t1/2 of deprotection and EGFP maturation of 98 min. Error bars represent standard deviations from three cells.

