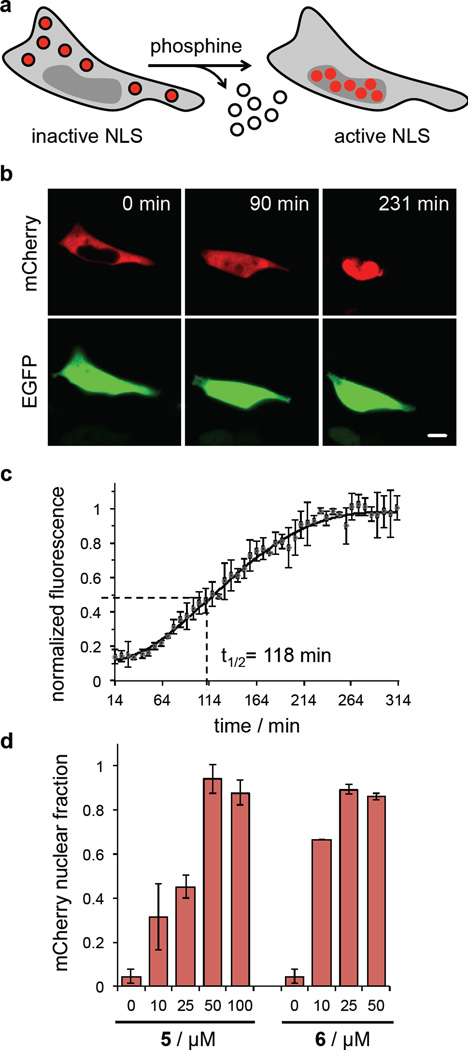
Figure 4. Small molecule-triggered protein translocation.
(a) Site-specific incorporation of OABK at K29 in the SATB1 nuclear localization sequence leads to complete exclusion of mCherry from the nucleus, until the wild-type NLS is generated through treatment with the phosphine 5. (b) Micrographs of HEK293T cells showing no nuclear localization of OABK-SATB1-mCherry and complete activation of translocation from the cytoplasm to the nucleus after activation with 5. EGFP expression was used as a transfection and imaging control. Scale bar represents 10 µm. (c) In order to determine the kinetics of the phosphine deprotection coupled nuclear translocation, time-lapse imaging was conducted and normalized mCherry fluorescence in the nucleus indicates a combined t1/2 of 118 min. Error bars represent standard deviations from three cells. (d) Dose-dependent mCherry nuclear import through activation of SatB1 translocation with different concentrations of 5 and 6 revealed the ability to titrate the biological effect and the high triggering efficiency of the phosphine 6 at concentrations as low as 25 µM. Fluorescent cells were imaged in four randomly selected fields of view per well, and fluorescence intensities were determined and normalized to the maximum fluorescence intensity in (c).Data was analyzed using ImageJ. Error bars represent standard deviations from four cells.

