
Fig 3. Close-up View of the GBS GAPDH Active Site.
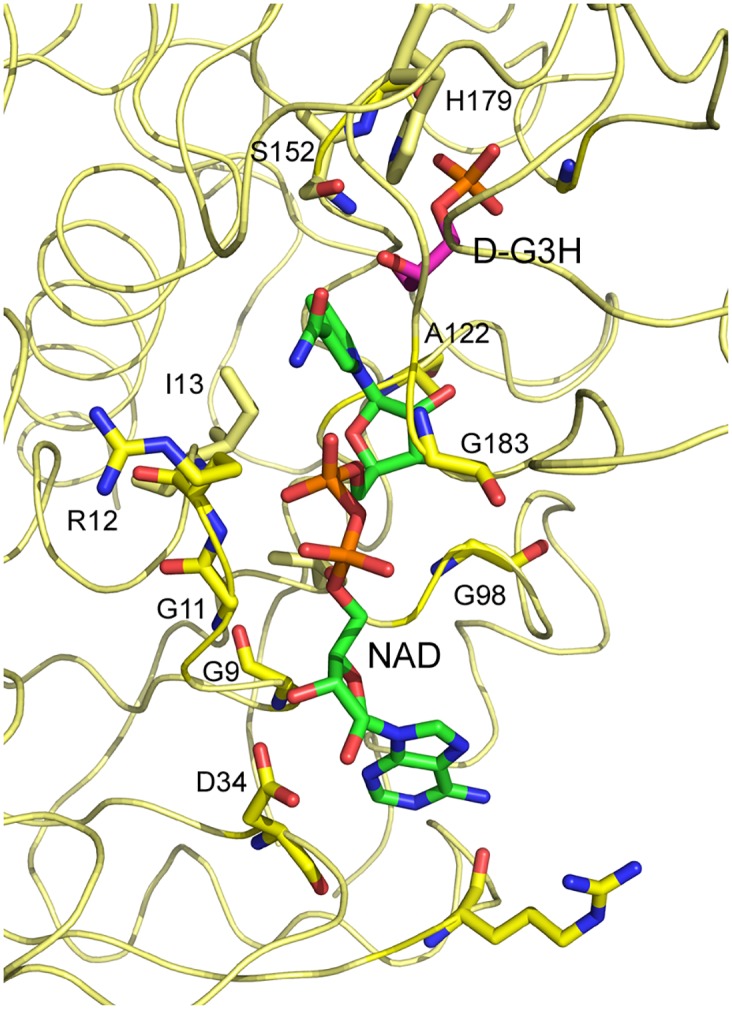
NAD+, D-G3H and residues within 3.5 Å from either ligand are displayed as stick models. Color code: N blue, O red, P orange and C yellow (protein), green (NAD+), magenta (D-G3H)
Official websites use .gov
A
.gov website belongs to an official
government organization in the United States.
Secure .gov websites use HTTPS
A lock (
) or https:// means you've safely
connected to the .gov website. Share sensitive
information only on official, secure websites.
NAD+, D-G3H and residues within 3.5 Å from either ligand are displayed as stick models. Color code: N blue, O red, P orange and C yellow (protein), green (NAD+), magenta (D-G3H)