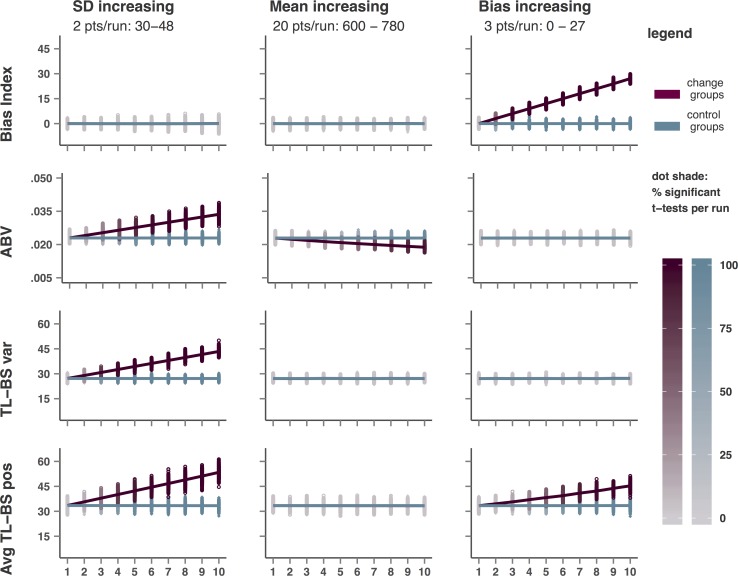
Fig 2. Observed average values of BI, ABV, TL-BS variability, and Average TL-BS positive for each study and each run of the first three simulation series (SD, mean, and bias increasing).
Each data point represents the group average for a single study, lines represents the average observed for each run of 1000 studies. The shades of the data points (but not the lines) indicate the percentage significant group differences observed per run (1000 studies).

