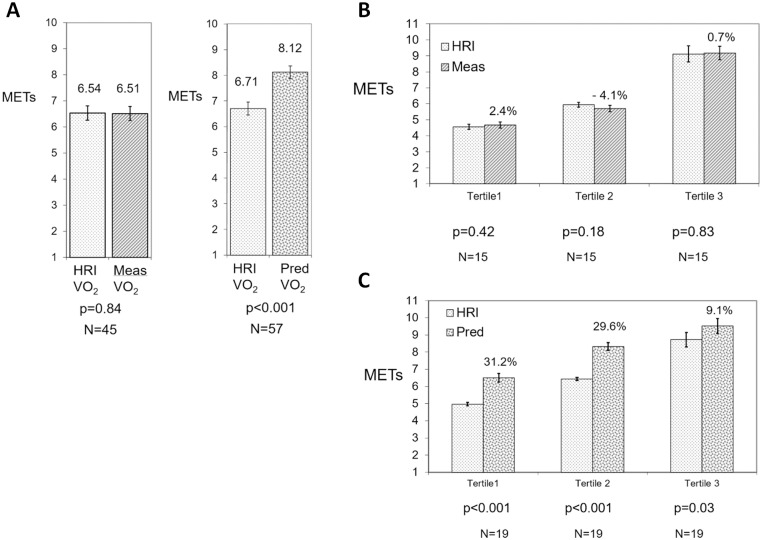
Fig 3. Comparison of pooled data from 20 studies for TM-VO2meas and TM-VO2pred against HRI-VO2.
A. Comparison of group mean data for 20 TM-VO2meas and TM-VO2pred studies against HRI-VO2 (mean ± SE), B. Comparison of cardiorespiratory fitness tertiles from 20 studies for TM-VO2meas against HRI-VO2 (mean ±SE). Percentage difference between TM-VO2meas and HRI-VO2 shown within figure and C. Comparison of cardiorespiratory fitness tertiles from 20 studies for TM-VO2pred against HRI-VO2 (mean ±SE). Percentage difference between TM-VO2pred and HRI-VO2 shown within figure.

