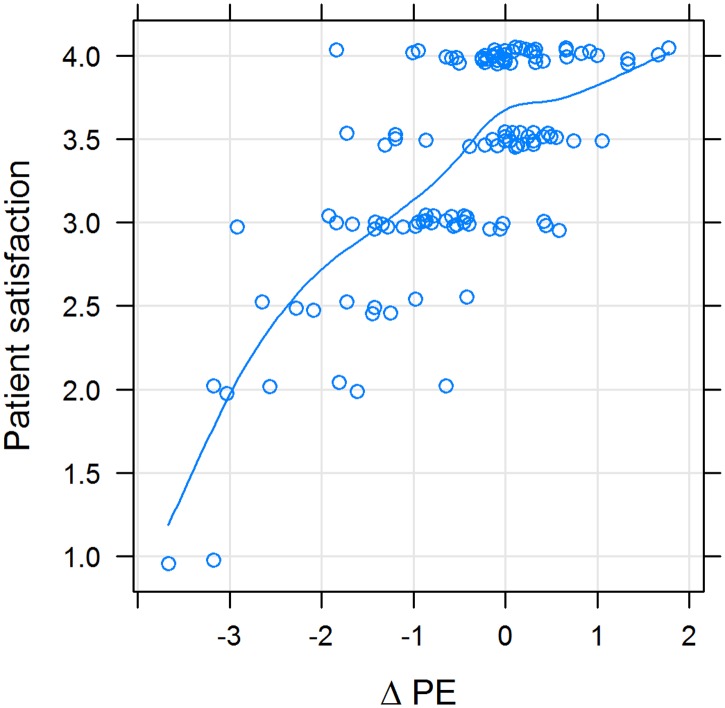
Fig 5. Patient satisfaction with the physician as a function of the difference between desired and perceived physician empathy (ΔPE); X-Y scatterplot.
Variables were positively correlated (rho = 0.47; p < 10−10). The line represents a cubic smoothing spline fit. If ΔPE was negative, patient satisfaction was low and rose steeply; and if it was positive, patient satisfaction rose less steeply.

