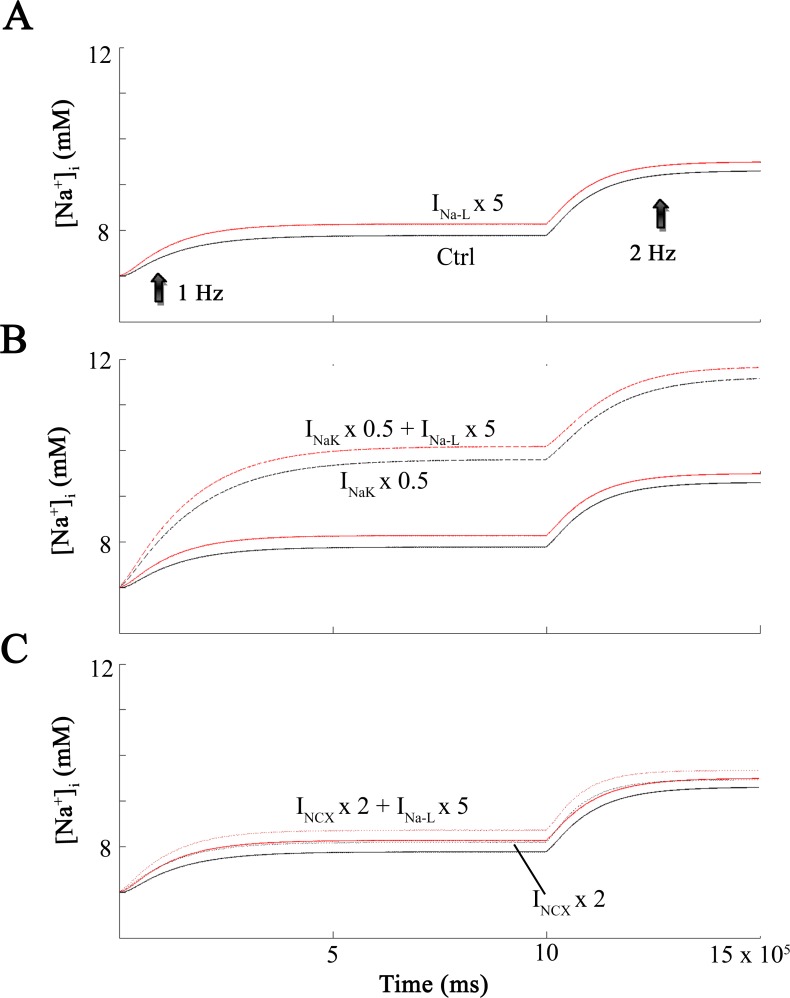
Fig 3. [Na+]i levels at increasing frequencies.
Demonstration of intracellular Na+ levels ([Na+]i during maneuvers that form the basis of this paper. Each in silico test involved the application of 1000 stimuli applied at a rate of 1 Hz (left) and then 2 Hz (right). This maneuver was done under baseline conditions (black) and also after increasing INaL 5-fold (red). Effects on [Na+]i are shown in Panel A. The remaining data sets correspond to 50% inhibition of INaK (discontinuous black curve) and 50% inhibition of INaK and 5-fold increase of INaL (discontinuous red curve) in Panel B. In Panel C the black dotted curve corresponds to a 2-fold increase in INCX, and the dotted red curve corresponds to a 2-fold increase in INCX and a 5-fold increase in INaL.

