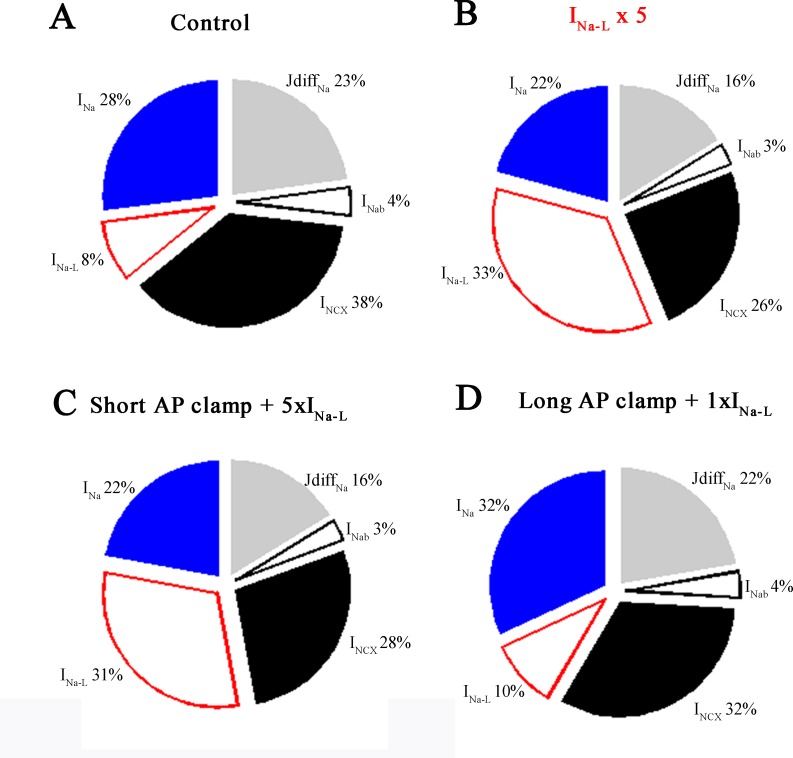
Fig 6. Relative Na+ fluxes.
The relative contributions of selected Na+ flux pathways to [Na+]i homeostasis. These relative flux values were calculated during the last AP (number 700) for each of the four conditions described in Figs 2 and 4. Simulations were conducted at 1 Hz: (A) steady-state control conditions (current clamp), (B) a 5-fold increase in INa-L (current clamp), (C) short AP clamp and a 5-fold increase in INa-L (short AP + 5×INaL), and (D) long AP clamp with normal INa-L (long AP + 1×INaL).

